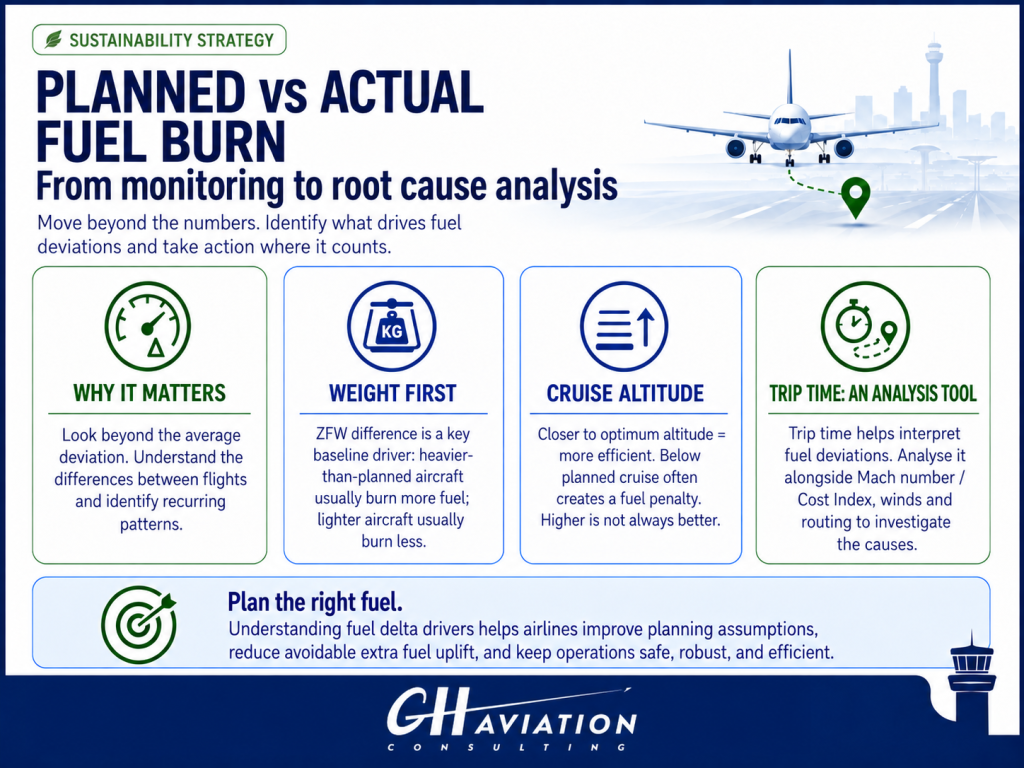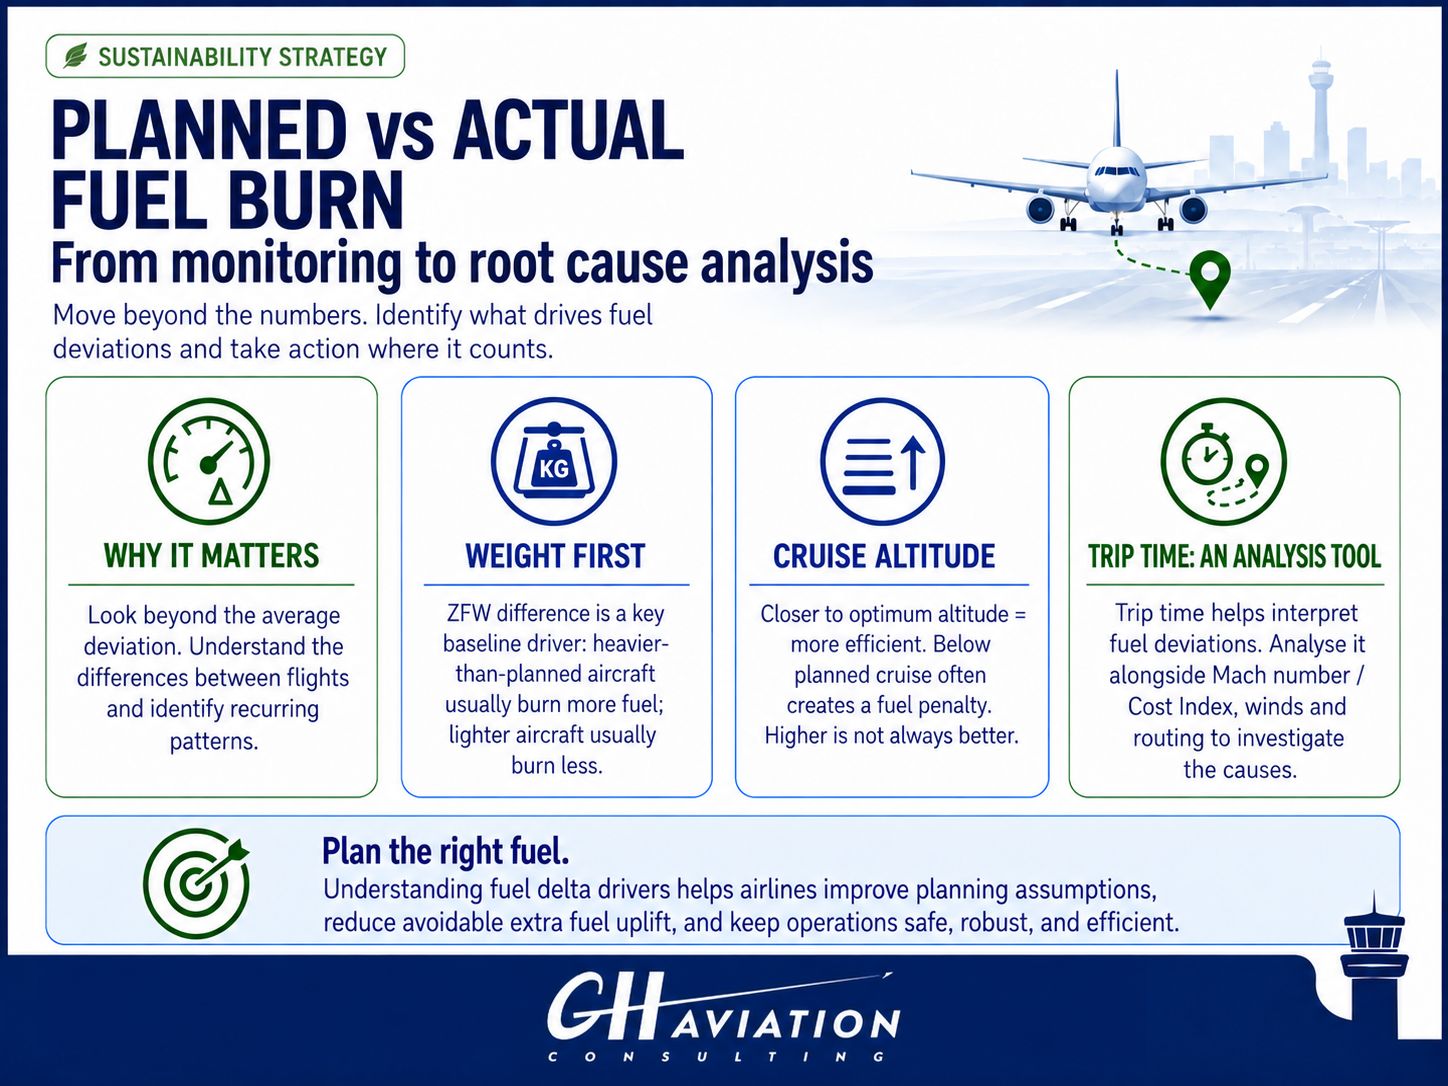
For airlines tracking the difference between the planned fuel burn (from the flight planning system) and the actual fuel burn (from aircraft sensors) is a recommended best practice. But monitoring the fuel delta alone does not explain what happened, or what should change.
Drawing on our fuel-efficiency assignments, this article sets out a practical approach to feed recurring findings back into flight planning to improve predictions and save fuel.
Why understanding fuel deviation matters?
The average or median difference between planned and actual fuel burn helps to confirm the global accuracy of the flight plan system and the performance factor calculations. However, a small average can conceal substantial positive and negative deviations. Looking at the distribution, and investigating recurring patterns within comparable groups of flights, helps identify where planning assumptions may need to change.
Prediction accuracy and operational efficiency have different objectives. A lower-than-planned fuel burn does not, on its own, demonstrate an efficient flight. It may reflect favourable operating conditions, conservative planning assumptions, or a combination of both. Understanding which conditions can reasonably be anticipated is what allows a favourable result to inform future fuel planning.
Improving fuel prediction accuracy on each flight enables to carry the right quantity of fuel and gain trust in the flight planning system, avoiding the use of extra fuel. Enhanced fuel prediction improve even more the flights that burn less fuel than planned, and ensures that the flights that burn more fuel than planned are covered by the fuel policy.
The key question is : When actual fuel differs from planned fuel, which actions should be conducted?
Three main variables to investigate
Fuel deviations can reflect aircraft performance, mass, speed, weather, ATC constraints, climb and descent profiles, or changes in routing. These factors interact and should not be interpreted in isolation.
In the cases we analysed, aircraft weight differences were the largest contributor to fuel burn deviations, followed by cruise altitude deviations. . Trip time was also an important diagnostic variable. Lateral deviations (shortcuts, flight optimizers,….) are also an important part of fuel differences, they will be covered in another article 😉.
Aircraft weight: the leading contributor in our analyses
Under comparable operating conditions, an aircraft that is heavier than planned requires more fuel. In our analyses, differences between planned and actual zero fuel weight (ZFW) were a major explanation for shifts in fuel delta.
What to check
Compare the ZFW used in the reference flight plan with the actual ZFW, accounting for any pre-departure updates. Examine whether differences are isolated or recur on particular routes or operating contexts. Check the assumptions and timing of the payload information supplied to planning. Actual fuel carried should also be considered, as it contributes to the aircraft’s total weight.
Weight differences does not explain everything. Even when flights are compared at similar ZFW, some fuel deviations remain : A heavier-than-planned aircraft can still consume less than planned if other operational conditions are favourable, for example if the flown cruise altitude, winds or trip time are better than expected. This means that other operational drivers must also be investigated.
Cruise altitude: understanding the planned and flown profiles
Cruise altitude was the second contributor in the cases we analysed. Interpreting its effect requires distinguishing the planned cruise profile, the optimum altitude under specified conditions, and the profile actually flown.
The principle behind step climbs
For a given cruise speed and aircraft weight, fuel efficiency varies with altitude. The optimum altitude is not fixed throughout the flight. As fuel is consumed, aircraft weight decreases and, for a given cruise speed and comparable atmospheric conditions, the optimum altitude generally increases.
Step climbs allow the aircraft to follow this evolving optimum through successive cruise levels, subject to aircraft performance, winds and ATC clearance. The aircraft may operate above or below the theoretical optimum during each level segment.

Figure 1. Conceptual illustration of step climbs following an evolving optimum altitude.
The objective is to fly as close as possible to the optimum altitude for the aircraft’s current weight and Mach number to optimise the fuel burn. The Airbus “Getting to Grips with Fuel Economy” extract shown below illustrates that flying away from the optimum altitude means more fuel burn. The penalty is generally limited when the aircraft is within approximately 2,000 ft of the optimum altitude, but it increases significantly when the aircraft flies several thousand feet below optimum.

Figure 2: Extract from ”Getting to Grips with Fuel Economy”, Airbus
What to check
Compare the complete planned and flown cruise profiles, including step-climb timing and time spent at each level. A single average altitude can hide important differences between flight segments.
Examine these differences together with actual aircraft weight, speed, winds and temperature. Identify whether level availability, turbulence, weather avoidance or tactical decisions explain the deviation. The aim is to distinguish a recurring mismatch in planning assumptions from a change made in response to the conditions of a particular flight.
In our experience, flights operated below the planned cruise profile often show higher-than-planned fuel burn. However we have also observed regularly lower-than-planned consumption on flights operated above that profile. Our interpretation is that it is possible that the actual optimal cruise altitude is sometimes above what is calculated at planning stage. This may be linked to conservative planning assumptions, forecast differences, ATC expectations, wind assumptions or aircraft weight assumptions that differ between the planned conditions and the actual conditions.
Trip time: a useful diagnostic variable
Trip time does not identify the cause on its own, but it helps interpret fuel delta. Differences in speed, winds, routing, altitude and holding can affect both duration and consumption. The following four combinations provide a useful starting point.
· Shorter trip time and higher fuel burn: in general the result of a higher cruise Mach number and/or a cruise at a lower altitude than planned.
· Shorter trip time and lower fuel burn: in general this means that the routing was shorter, or with more favourable wind. This can be confirmed comparing the Equivalent Still Air Distance (ESAD) and looking at the difference between the flown and planned tracks.
· Longer trip time and lower fuel burn: This happens in general if the flown Mach Number is lower than the planned one. Even if this situation results in a fuel saving, it could be even higher if the reasons are understood and translated into a lower fuel uplift.
· Longer trip time and higher fuel burn: Route extensions, holding or adverse winds are possible explanations. This result should also be assessed in relation to the remaining fuel situation and the conditions encountered during the flight.
What to check
Use the combination of trip time and fuel delta to prioritise the relevant checks: planned versus flown speed, vertical profile, ESAD, ground track, winds and holding. Then determine whether the difference reflects an isolated event or a recurring operating requirement. A favourable fuel result is useful for planning only to the extent that its causes can reasonably be anticipated.
Turn recurring findings into better flight planning
Once the causes have been investigated, the next step is to decide what should change. The following actions connect the analysis above to the planning process.
1. Improve weight inputs
Where ZFW differences recur, review payload assumptions and the timing of information supplied to planning. Where available and applicable, measured baggage weights may help refine assumptions. Define how last-minute loading changes are handled; EASA guidance addresses limits to ZFW changes beyond which a new operational flight plan should be calculated. [1]
2. Review cruise profiles and Mach/Cost Index assumptions
Where altitude or speed differences recur, review level selection, step-climb timing, forecast weather and expected operational constraints that are considered in the flight plan. If a different Mach number/Cost Index is routinely required, determine whether the planned Mach or cost index should reflect that requirement, considering the time implications as well as fuel consumption.
3. Reflect foreseeable routing constraints and delays
Distinguish repeatable operating conditions from isolated shortcuts, detours or holding events. Update routing assumptions where justified, and account for anticipated delays or specific operational constraints through the applicable fuel policy. In the EASA framework, these are addressed by extra fuel, while contingency fuel covers unforeseen factors. [1]
4. Check performance assumptions and verify the outcome
Where deviations remain unexplained, review aircraft performance factors and the data used to determine them.
After changing planning assumptions, assess whether prediction accuracy improves and whether any operational savings are sustained. A planning change should be supported by recurring evidence, rather than by the result of one flight.
Better predictions support better fuel decisions
The value of fuel delta analysis lies in turning operational findings into more reliable planning assumptions. Where lower consumption can reasonably be anticipated, a revised plan may support a lower required fuel load. Reliable predictions can also strengthen confidence among dispatchers and flight crews, helping avoid unnecessary planning margins while preserving required fuel provisions and the commander’s discretion.
At GH Aviation Consulting, we use planned-versus-actual fuel analysis to connect operational data with practical recommendations. The objective is to plan the right quantity of fuel for safe and robust operations, and identify where better information or operating choices can reduce consumption.
References
[1] EASA. Easy Access Rules for Air Operations, Revision 24, March 2026. CAT.OP.MPA.181 and associated AMC/GM; AMC1 CAT.OP.MPA.185. https://www.easa.europa.eu/en/document-library/easy-access-rules/online-publications/easy-access-rules-air-operations?erules-id=ERULES-1963177438-12803