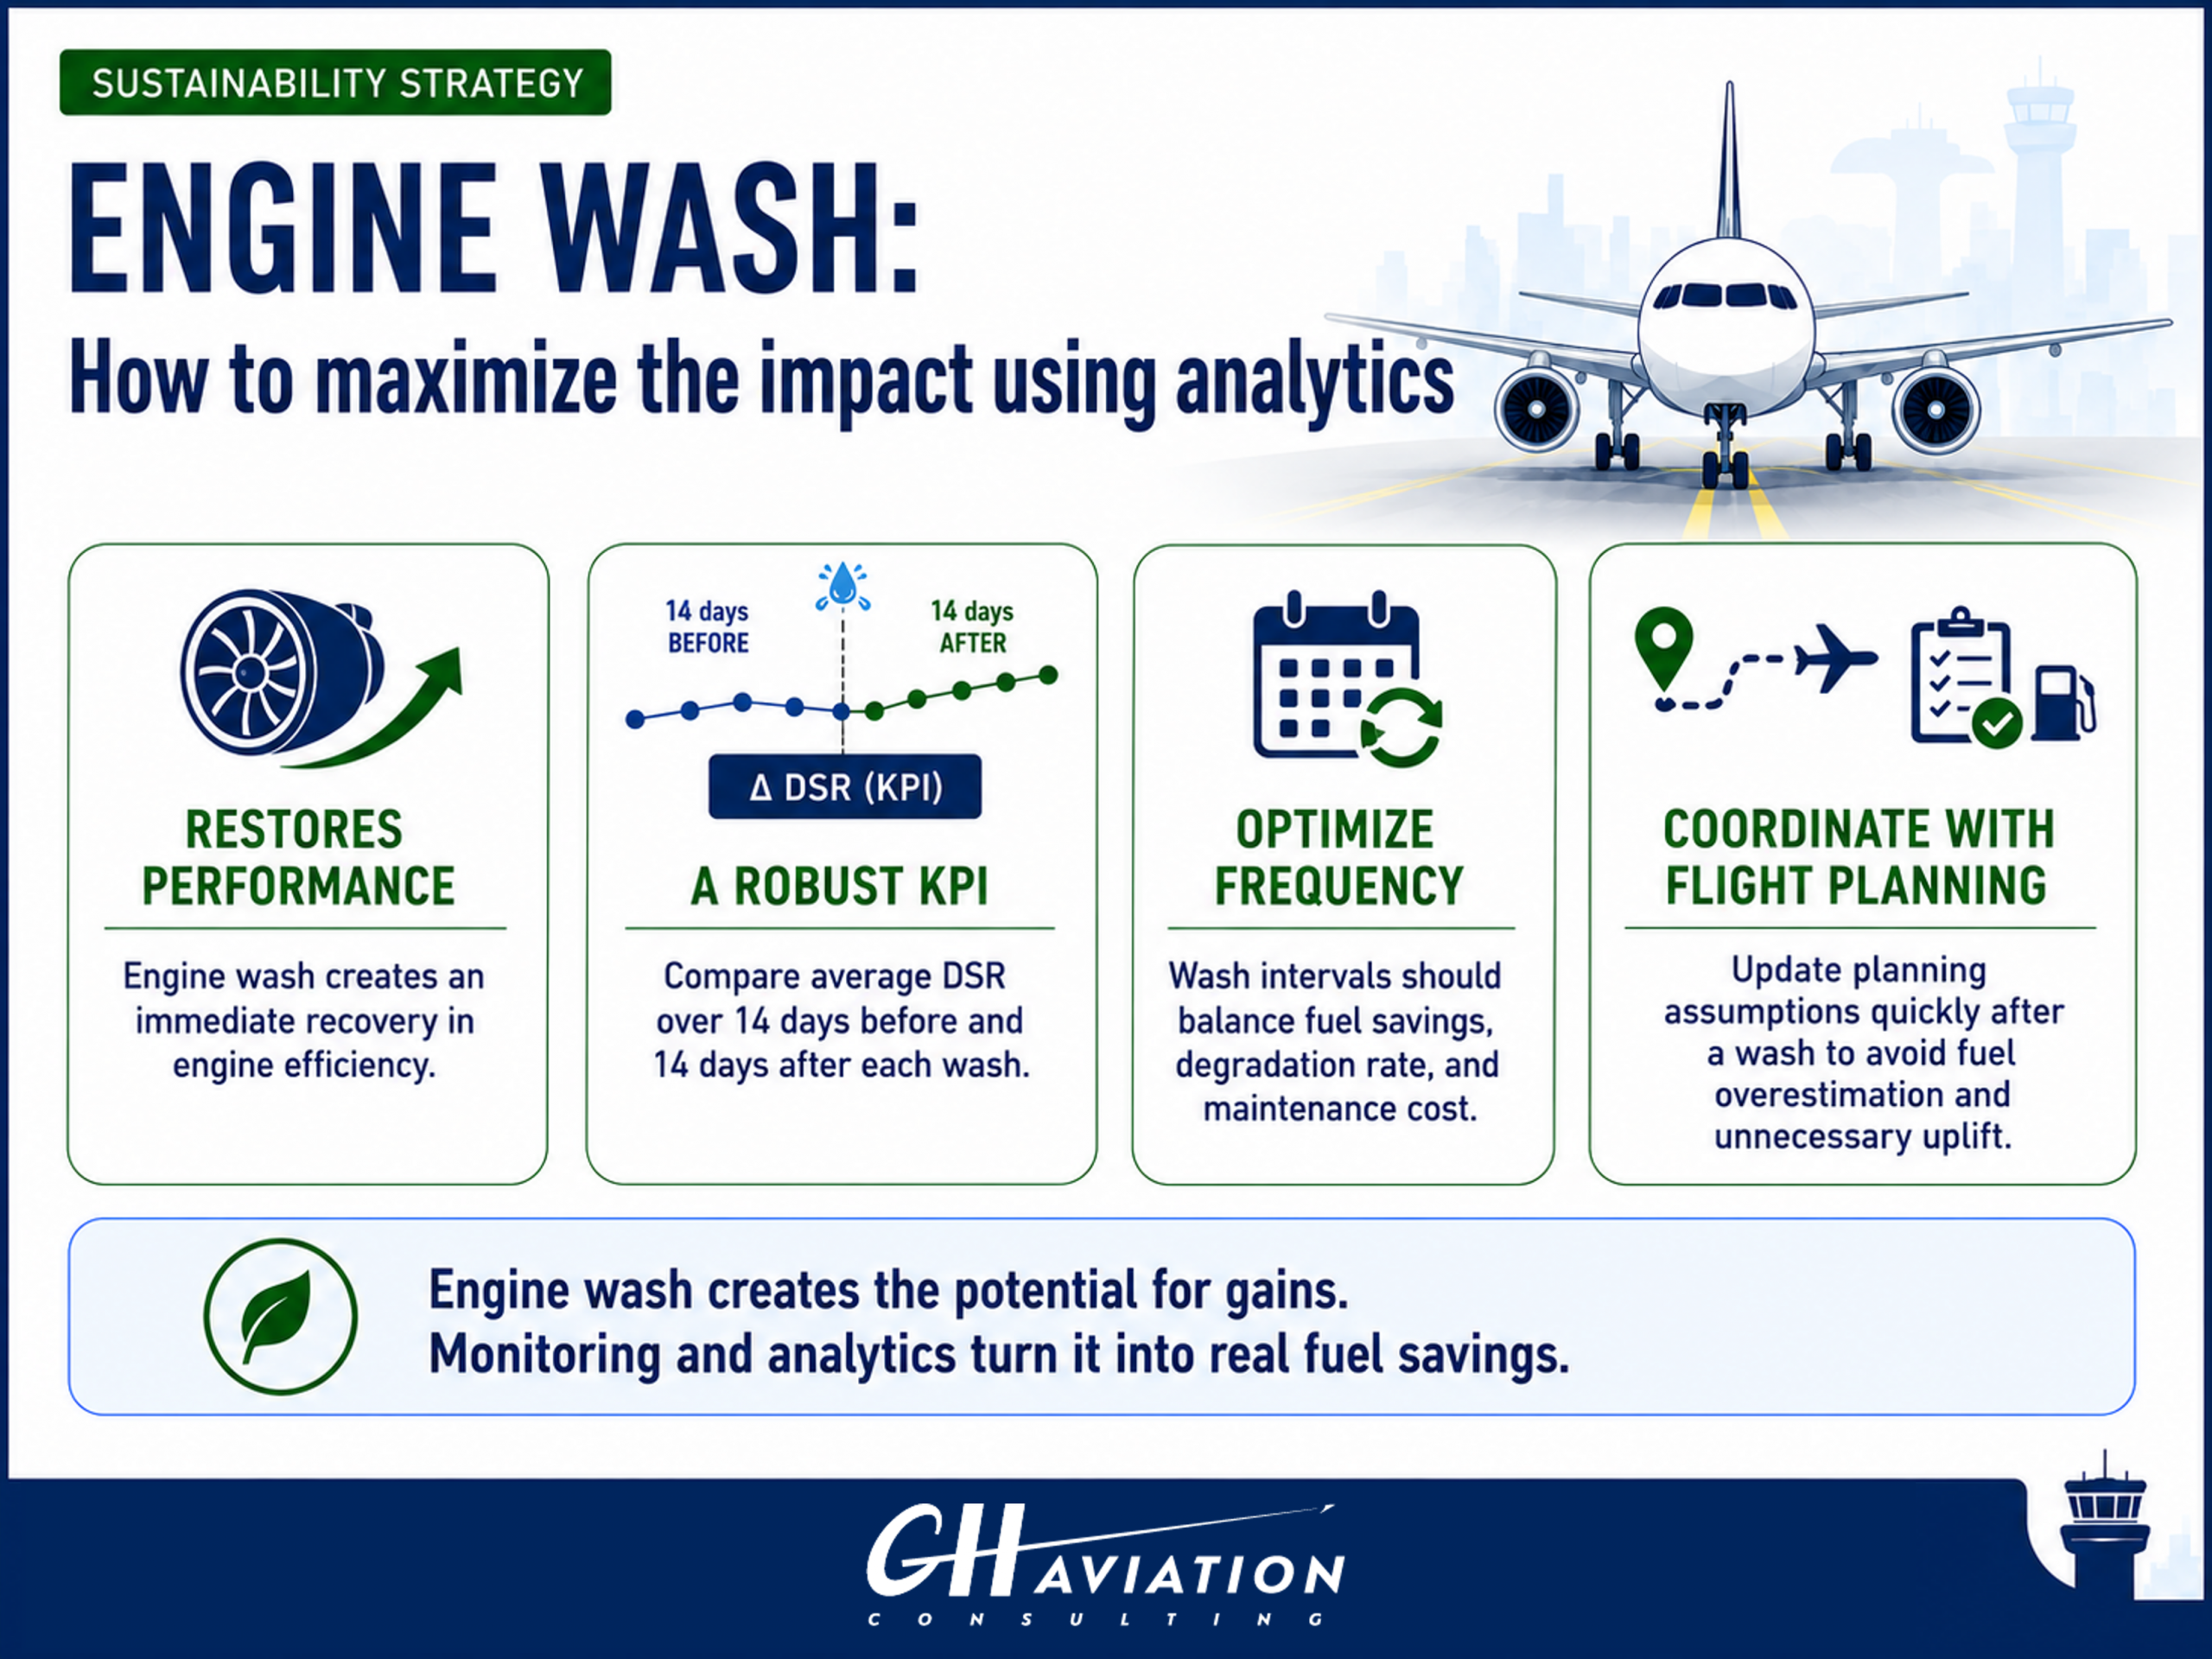
When performed in line with OEM recommendations, engine wash is a way to restore performance. The real value lies in the ability to monitor this effect accurately to optimize its implementation and maximize its impact thanks to proper coordination with flight planning.
This article describes the challenge of monitoring engine wash effects and obtaining statistics at tail or fleet level.
Background & natural degradation & aircraft performance monitoring
Aircraft engine performance degrades progressively over time as a result of normal operating conditions, including exposure to environmental factors such as sand, humidity, and pollution. This gradual deterioration has a direct impact on fuel burn and overall operational efficiency.
To monitor this evolution, airlines rely on performance monitoring KPIs, such as the Delta Specific Range (DSR), the Delta Specific Fuel Consumption (DSFC) or the Exhaust Gas Temperature (EGT), that are key indicators capturing deviations from the reference OEM engine performance level. Together, these metrics provide a consistent and reliable way to assess engine health over time and across flight cycles.
Note: The data shown in the following charts are based on a fictional dataset and are used for illustrative purposes only.
Immediate Impact of Engine Wash
Engine maintenance enables partially restoring degraded aircraft performance. Several actions are performed:
- Engine wash, every 300-500 flight cycles (as per OEM recommendations) – small but regular impact on performance
- Engine overhaul, that are done every 20,000 flight cycles typically. – higher impact, but performed at bigger intervals
Engine wash is therefore a standard maintenance task that introduces a clear and immediate shift in performance.
Because the factors reflecting engine health, such as EGT margin or Degradation Specific Range (DSR), can fluctuate significantly from one day to another, the impact of an engine wash cannot be assessed reliably from a single observation of the evolution of monitoring KPIs.
When visualizing these parameters directly, the data typically appears as highly scattered , making it difficult to clearly identify the effect of individual maintenance events.
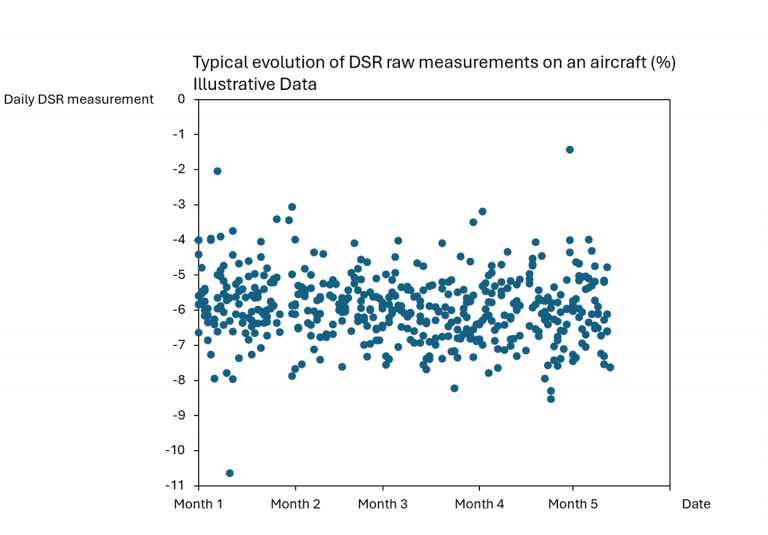
A first step to address this issue is to apply rolling averages, which smoothens out short-term variability and reveals underlying trends. However, even when using centered rolling averages, the impact of engine wash events often remains difficult to identify visually, as multiple sources of variability are involved.
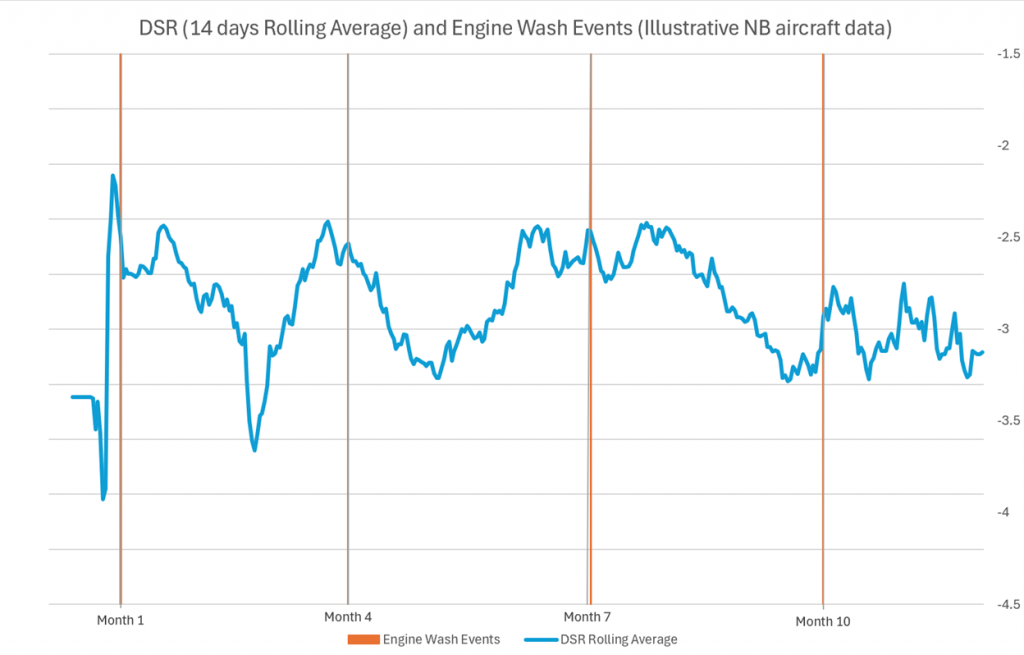
This highlights the need for a more robust and systematic approach. Rather than relying on visual interpretation, a consistent and comparable performance indicator must be defined. The objective is to build a KPI that can be applied across events, aircraft, and fleets, enabling robust statistical analysis. It will avoid relying on any tail-by-tail visual interpretation of parameters evolution, that is often misleading and not statistically accurate.
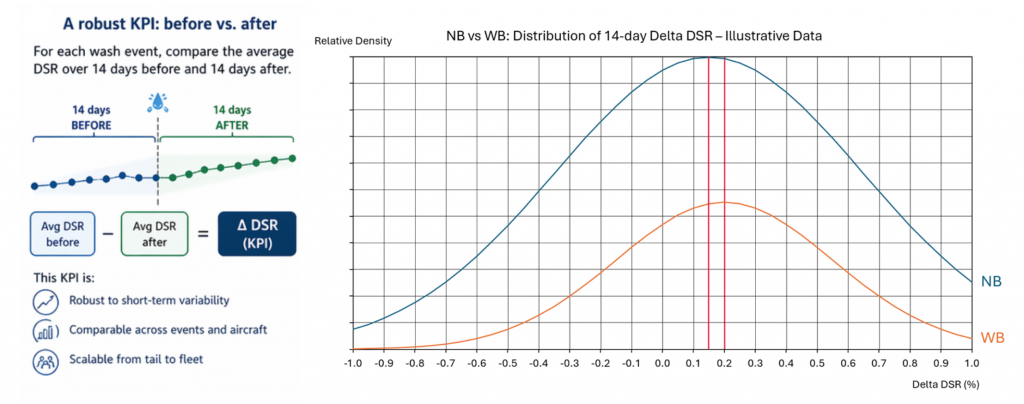
For each event, the methodology we have developed consists in comparing the average value of a given performance metric (DSR), over the 14 days preceding the wash with the average over the 14 days following the wash. The difference between these two moving windows defines a delta, which quantifies the performance recovery attributable to the engine wash.
This approach smoothens out short-term variability and avoids overinterpreting isolated fluctuations. It enables the definition of a standardized KPI that can be analyzed at different levels, from individual aircraft to the complete fleet.
This KPI provides a standardized and scalable way to benchmark performance recovery across aircraft and fleets.
Using this methodology, engine wash events consistently show a measurable improvement in performance, with an increase of a few percent in DSR, reflecting a reduction in engine degradation. This confirms that engine wash produces an immediate and quantifiable recovery in engine efficiency. It should be noted that in some cases, the delta DSR can be negative. This may result from measurement variability or from underlying operational conditions, where the benefits of the engine wash do not fully offset ongoing degradation. As a result, engine wash does not always lead to a measurable improvement at the individual event level, reinforcing the need for a statistical analysis across multiple events.
Note: the same analysis can be conducted with DSFC or EGT margins.
Engine wash frequency optimization
The frequency of engine washes plays a critical role in managing performance stability. Original equipment manufacturers typically recommend wash intervals in the range of 300 to 500 flight cycles, depending on the engine model and operating environment. These recommendations provide a baseline, but the optimal interval depends on operational conditions. When washes are performed at shorter intervals, the accumulation of degradation is limited, resulting in a more stable performance profile over time but comes with additional costs that may outweigh the fuel savings benefits. Conversely, longer intervals between washes allow degradation to build up more significantly, leading to deeper performance drops before recovery.
Even if manufacturers provide a recommended interval for the engine wash, airlines can assess the benefits in fuel savings compared to the cost of the maintenance task (including a longer time spent on the ground for the aircraft). The rate of performance degradation depends on the airline environment and the engine type. Monitoring thoroughly the effects of engine wash can therefore enable the optimization of the frequency of engine wash in a customized manner.
Coordination with flight planning
While engine performance improves immediately after a wash, flight planning does not always reflect this change with the same responsiveness.
In practice, the performance factor used in planning may remain unchanged for several days or even weeks following a maintenance event. This creates a mismatch between actual aircraft performance and the assumptions used in flight planning. The aircraft operates with improved efficiency, but planning systems continue to assume a degraded state.
As a result, the planned fuel burn is overestimated, leading to unnecessary fuel uplift and missed efficiency gains. In effect, operations continue to be planned based on a performance level that no longer reflects the true condition of the engine.
As a golden rule, it is therefore key to not only monitor the effect of engine wash on performance but also to reflect this effect in the calculation of the fuel uplift to maximize the impact on aircraft fuel burn.
Conclusion
Engine wash provides an immediate and measurable improvement in aircraft performance. However, the real value lies in monitoring this improvement in a consistent way.
By defining standardized KPIs, it becomes possible to quantify the impact of engine wash, to compare performance across aircraft and to assess the effectiveness of maintenance strategies aiming at restoring engine performance.
This data-driven approach enables operators not only to follow best practices, but to continuously optimize them by assessing for instance the most optimized interval between washes, ensuring that maintenance actions translate into tangible fuel savings.
Engine wash creates the potential for performance gains, monitoring and analysis are what turns this potential into tangible operational and economic value.
Interested in implementing this capability? Contact us!
